How to Read Your Profit and Loss Statement (And What It's Actually Telling You)
Key Takeaways
- A P&L statement shows revenue minus expenses, resulting in net profit or loss for a given period.
- Track gross profit separately from net profit — gross shows operational performance, net shows true profitability.
- Review your P&L monthly, not just at tax time — monthly reviews catch expense creep before it becomes a problem.
- Your P&L is the primary document lenders, investors, and accountants will request when evaluating your business.
The profit and loss statement — also called the P&L, income statement, or statement of operations — is the most important financial document for any business. It tells you whether your business is actually making money, where your money is coming from, and where it is going.
Most small business owners skip it entirely and rely on their bank balance as a proxy for financial health. This is a mistake that hides real problems until they become serious.
What a P&L statement actually is
A profit and loss statement summarizes your business's revenues and expenses over a specific period — typically a month, a quarter, or a year. It answers the single most important question in business: Did we make money during this period?
The structure is straightforward:
Revenue
- Cost of Goods Sold (COGS) / Direct Costs
= Gross Profit
- Operating Expenses
= Net Profit (or Loss)
Each of these sections tells you something specific about your business.
Revenue: the top line
Revenue is all the money your business brought in during the period from selling products or services. For a service business, this is typically the total of all invoices issued. For a product business, it is the total sales value of products sold.
Revenue is not the same as cash received. If you invoiced a client $5,000 in March but they paid in April, that $5,000 is March revenue — even if your bank account didn't see it until April. This distinction matters a lot and is one reason why checking your bank balance tells you less than you think.
Cost of Goods Sold: the direct costs
COGS (or direct costs for service businesses) are the costs directly associated with delivering your product or service. For a contractor, this is materials and labor. For a product business, it is the cost of the products sold. For a consultant, it might be subcontractor costs.
Tracking COGS separately from other expenses is important because it lets you calculate gross profit — what you make before any overhead.
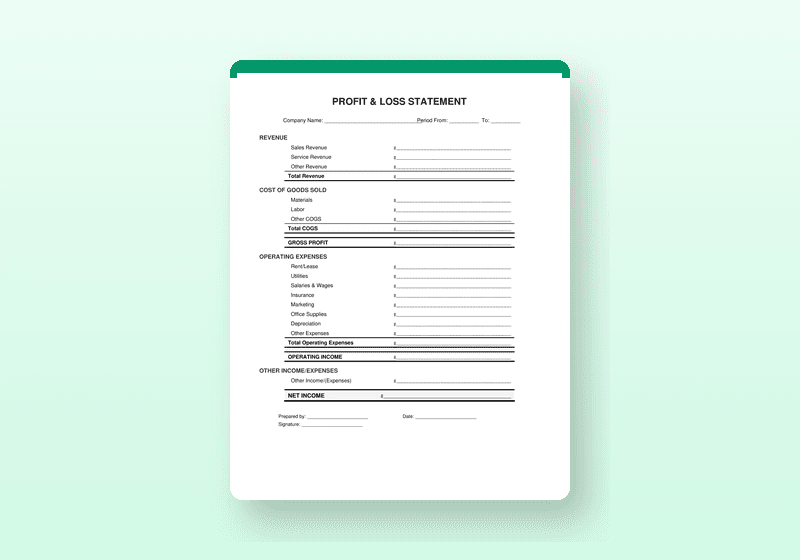
Profit & Loss Statement Templates
The template this guide walks through — ready to customize with your details in PDF, ZIP Bundle formats.
Gross profit: what you actually make from the work
Gross profit is Revenue minus COGS. It tells you how much you make from the actual work before paying for the overhead required to run the business.
Gross profit margin — gross profit expressed as a percentage of revenue — is one of the most important benchmarks for any business. Industry averages vary significantly. Service businesses often have 50-70% gross margins. Product businesses might operate at 30-50%. Retail can be much lower.
If your gross margin is declining over time, you are either charging too little, spending too much on direct costs, or both.
Operating expenses: the overhead
Operating expenses are the costs of running the business that are not directly tied to specific jobs or products. These include:
- Rent and utilities for your office or shop
- Salaries (yours included, if you pay yourself a salary)
- Insurance
- Marketing and advertising
- Software subscriptions
- Professional services (bookkeeper, attorney)
- Vehicle expenses
- Equipment depreciation
These costs happen whether you have one client or ten. They are fixed (or semi-fixed) costs that you carry regardless of how much work you do.
Net profit: the bottom line
Net profit is what remains after all expenses — both direct costs and operating expenses — have been deducted from revenue. This is what actually flows to you as the business owner (before taxes).
Consistently negative net profit means the business is not sustainable at its current cost structure or revenue level. Positive net profit but poor cash flow usually means you have a collection problem or a timing issue between when you invoice and when you get paid.
How to actually use your P&L
Running a P&L monthly and comparing it to prior months — and to the same month last year — tells you things that are invisible if you only look at your bank balance:
- Is revenue trending up or down?
- Are your gross margins holding steady or shrinking?
- Are specific expense categories growing faster than revenue?
- Are you actually profitable, or are you drawing down savings without realizing it?
Most small business owners who start running monthly P&Ls are surprised by what they find. The business that "feels like it's doing well" sometimes has shrinking margins. The slow month that "felt bad" sometimes produced the highest profit because expenses were controlled.
The practical first step
If you are not currently running a P&L, start with a simple spreadsheet template and fill it in monthly with your actual numbers. It does not need to be complicated — a straightforward format with revenue, direct costs, and expense categories organized clearly will tell you most of what you need to know.
Once you have three to six months of data, patterns emerge that will change how you manage your business. That is the point of the exercise.
Frequently Asked Questions
What is a profit and loss statement?
A profit and loss statement (also called an income statement) is a financial document that summarises a business's revenues, costs, and expenses over a specific period. It shows whether the business made a profit or incurred a loss. It is one of the three core financial statements used to assess business performance.
How often should a small business prepare a P&L statement?
Small businesses should prepare a P&L statement monthly at minimum. Monthly P&Ls allow you to catch expense trends early, identify profitable and unprofitable periods, and have accurate data for tax planning. Quarterly and annual P&Ls are required for tax filing and essential for lender or investor review.
What is the difference between gross profit and net profit?
Gross profit is revenue minus the direct costs of producing your goods or services (cost of goods sold). Net profit is gross profit minus all other operating expenses including overhead, payroll, rent, and taxes. Gross profit shows how efficiently you deliver your product or service; net profit shows what you actually keep.
Do I need accounting software to create a P&L?
No. A well-structured P&L template in Excel or a fillable PDF is sufficient for most small businesses that do not have complex accounting needs. Accounting software generates P&Ls automatically from transaction data, but a manual template works reliably for businesses with straightforward income and expense categories.
Profit & Loss Statement Templates
Professionally designed and formatted. Available in PDF, ZIP Bundle formats. 30-day money-back guarantee.
One-time purchase — use forever.
Related Guides
Founder, PrintReadyForms · 25 years writing technical documents, contracts, scopes of work, and procedures
Published · Updated April 1, 2026
All guides on PrintReadyForms are written to help business owners, landlords, contractors, and HR professionals use professional documents effectively. This content is for informational purposes only and does not constitute legal or financial advice. Consult a qualified professional for advice specific to your situation.